How Quants Use Graph Engineering to Protect Alpha (Full Framework)

You built the loop: generate, test, score, refine, repeat. The metric climbed for months. Then live trading torched it, with every dashboard light still green. The answer is graph engineering: wiring loops that watch, feed, and veto other loops, anchored to numbers that cannot be argued with.
Let's get straight to it.
> Bookmark this. We are the team behind Horizon, the first agentic trading platform: type your strategy in plain English, backtest, deploy live. Graph engineering is the structure that keeps that flow honest. Now live with a free trial. Join 4,800+ traders at horizon.trade or DM @horizon_trade_x
The loop could only see its own metric. Loop engineering finds the edge. Graph engineering keeps it alive: loops auditing each other instead of trusting themselves.
We are going to break down the four scheduled failures of a single loop, the structure that answers each, and the anchor that keeps it honest.
Here is the roadmap:
- Four ways a single loop fails, on schedule
- The graph: pairing, hierarchy, arbitration, audit
- The trap that kills the graph too
- The anchors that keep it honest
- Where Horizon runs the graph
The metric gets gamed
A loop can only see its metric. That is what makes it a loop, and it will find every way to move the number, including the ways that betray its purpose. In trading, this is overfitting: optimize Sharpe through 400 iterations and you get a beautiful Sharpe on the past. That number measures your persistence more than your edge. Economists call it Goodhart's law.
The target nobody questions
A loop drives toward a reference, and nothing inside it can ask whether the reference is right. The loop optimizing "beat SPY" cannot ask whether SPY fits a strategy holding 60% cash. Somebody set that target long ago, by instinct. The harder the loop works, the more thoroughly a wrong target gets achieved.
Loops fight each other
Real portfolios hold many loops, and loops built independently collide. The loop tightening stops to cut drawdown fights the loop widening stops to cut whipsaw. The sizing loop scaling into winners fights the risk loop capping concentration. Each, alone, performs beautifully. Together they churn the account.
The measurement quietly dies
Regimes shift, correlations break, and the loop keeps cycling on data whose meaning has moved while the dashboard stays green. At worst, backtests confirm backtests and the paper account confirms the fill model that generated it. A loop cycling on schedule while its measurements have detached from the market is theatre with good attendance.
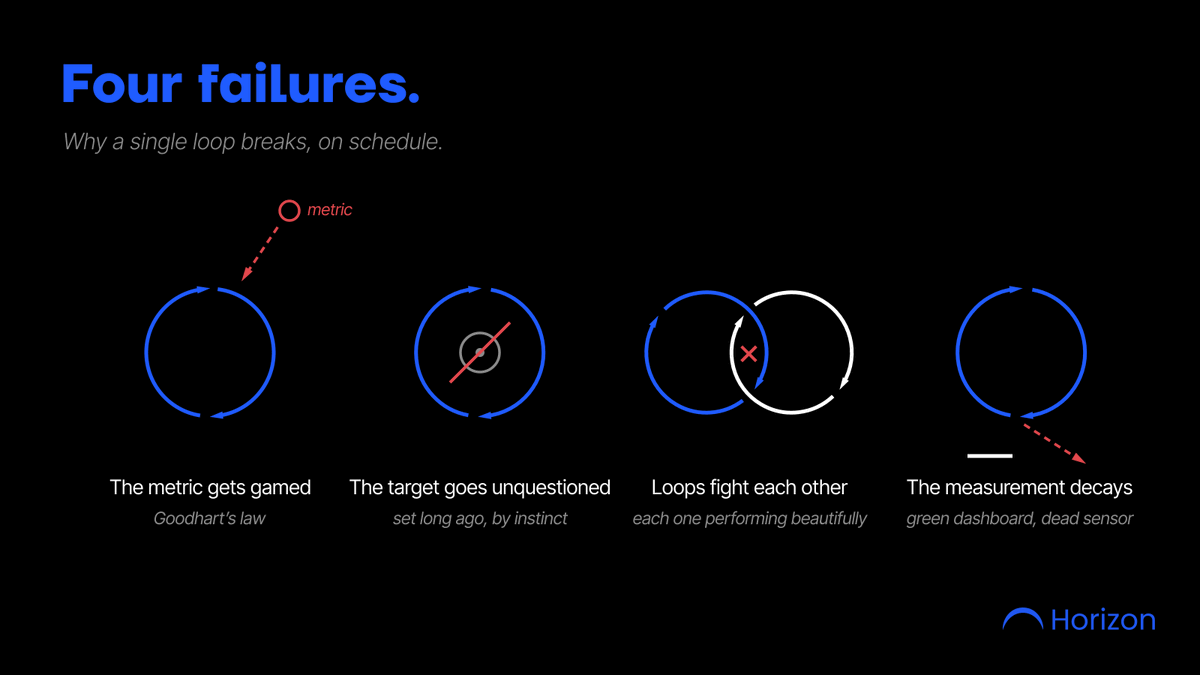 — "the four break points"
The graph: loops watching loops
Serious desks answered all four with structure, one edge per failure.
Pairing answers Goodhart. Every optimizing metric travels with a counter-metric chosen to catch the cheap way to win. Return pairs with slippage. In-sample score pairs with a held-out score the optimizer never touched.
Hierarchy answers the blind target. A slower loop owns the faster loop's reference: the daily loop trades, a weekly loop re-tunes, a quarterly loop questions the benchmark itself.
Arbitration answers conflict. Portfolio-level allocation sits above the strategy loops and owns the trade-offs between them, by rule.
Audit answers decay. Champion-challenger: a new version must beat the incumbent before replacing it. Drift monitors flag when today's data stops resembling the training data. Kill switches trigger at bounds written in advance. The reliability lives in the edges: which loop feeds which, watches which, can veto which.
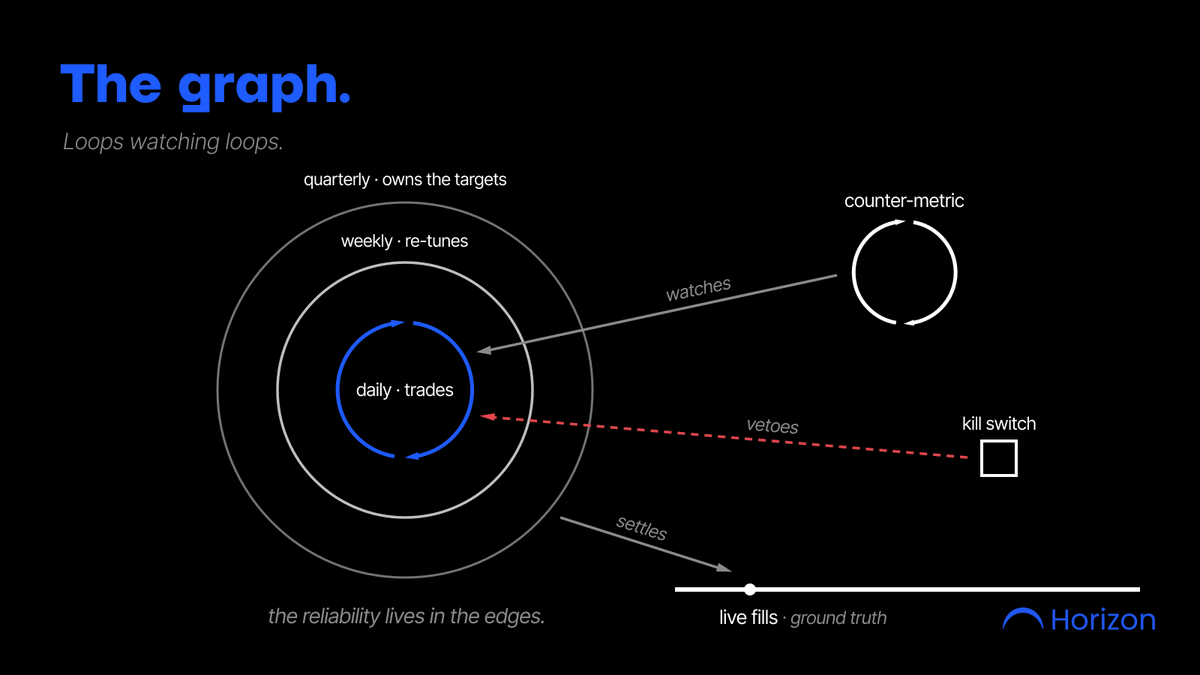 — "nested loop speeds"
The trap that kills the graph too
Build the full graph and every loop can end up watching another loop while none touches the market: backtest against walk-forward, walk-forward against paper, paper on the backtest's fill assumptions. Everything is consistent. Nothing is verified. It fails like the single loop, only later, more expensively, with more green lights on the way down.
 — "circular graph"
The anchors that keep it honest
The graph needs measurements that cannot be argued with: real fills, PnL that settled in the account. It needs frozen rules the optimizer would love to loosen: the holdout it never sees, the max drawdown that halts trading however confident the model feels. A touched holdout stops being one. And what "better" means at the root comes from outside the graph. That judgment stays yours.
Where Horizon runs this graph
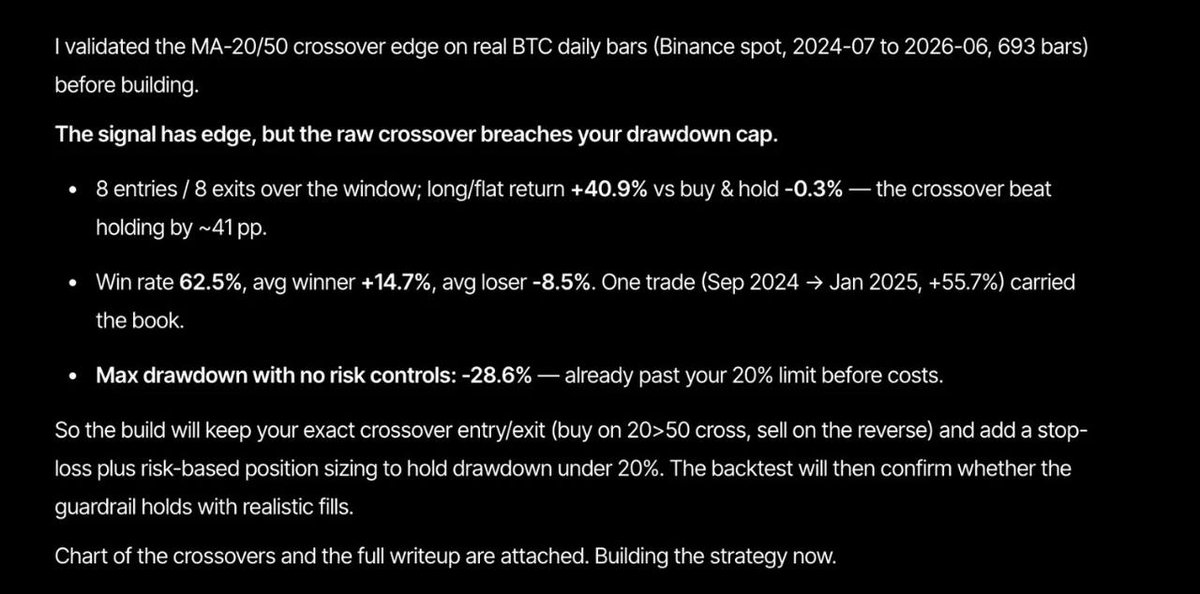
On Horizon, the fast loop takes minutes: describe a strategy in plain English and get a few variants to compare instead of one answer. It backtests each, scores them on returns, Sharpe, and drawdown, and keeps every version side by side: the new one must beat the old one before earning anything.
That is champion-challenger at conversation speed. A candidate that holds up deploys live to your exchange, and the graph settles against its anchor: real fills. The gap between backtest score and live result is the most honest number in the system. Horizon shows both. The slow loops stay yours: targets, risk budget, kill criteria.
[IMAGE → CARD 5: card5-champion-challenger — real V1 vs V2 backtest table in brand frame; goes AFTER the Horizon paragraph, echoes "the new one must beat the old one"]

How traders get graph engineering wrong
Trusting a metric travelling alone. It will eventually be gamed by your own process.
Letting the optimizer touch the holdout. One peek converts out-of-sample into training data.
Running the fast loop at the slow loop's job. A losing week is variance until proven otherwise. Refitting after every one thrashes what the quarterly loop stewards.
Building dashboards that confirm each other. If no number settled in a real account, every green light is decorative.
The checklist
Pair every metric with a counter-metric. Give every target an owner and a review date. Write kill criteria before deployment and freeze them. Keep one holdout the optimizer never touches. Settle the graph against live fills, the only node that cannot lie.
A single loop tells you the number went up. Only the graph tells you whether it was ever real.
> Before you go. We are the team behind Horizon, the first agentic trading platform: type your strategy in plain English, backtest, deploy live. Graph engineering is what turns one lucky backtest into an edge that survives contact with the market. Now live with a free trial. Join 4,800+ traders at horizon.trade or DM @horizon_trade_x.
Related articles

how to run an ai native agency with jev (FULL GUIDE)
jev is open to everyone now. it's a super fast decision model, so one person can now do work that businesses usually pay an agency a big cut for. here's how you can set up a whole ai native agency wi…

AI-native services: a $100B opportunity
AI-native services are here, and I think they're the best business you can start right now. There's probably $100 billion up for grabs. This is the full guide: what AI native services are, how to bui…

How to Build an AI-Native Company: Hiring, Standards, and Cadence
*We spent a year running hackathons, AI trainings, and office hours. But nothing changed until we made AI capability a requirement.*