Five Equations Decide Every Dollar Wall Street Makes
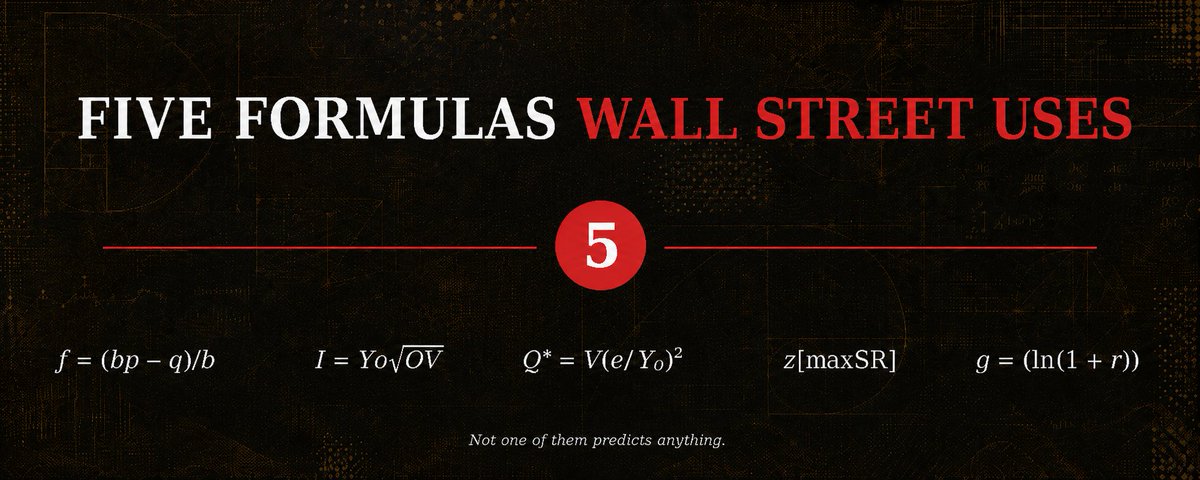
You are not losing to a better forecast. You are losing to five numbers nobody showed you: your bet size, your real cost, your ceiling, the odds your edge was luck, and the gap between the average return and the one you actually get.
In 2015, sitting on a TED stage, Jim Simons was asked why the most successful fund in the history of finance stopped taking money from outsiders. His answer was one sentence, and it had nothing to do with markets:
> "But at a certain point, as I think I told you, we bought out all the investors because there's a capacity to the fund."
Capacity. Not conviction, not secrecy, not a better forecast. A number, past which the machine stops working. He said it the way an engineer states a load limit.
That sentence is the whole subject of this article. What gets sold to the public as the business of Wall Street is prediction - the signal, the model, the person who saw it coming. What actually runs the business is a handful of equations that contain no forecast at all. They answer questions like how much, at what cost, how big before it breaks, was this ever real, and what survives time.
All five are public. All five are old. Most fit on one line. And every one of them can be computed with a calculator.
This is long, and each part builds on the one before it. But by the end you will hold the same five checks that decide, inside a real firm, whether a strategy gets funded or killed.
The five, at a glance
1. Position size. f* = (bp − q) / b - how much to risk per bet. Size it wrong upward and a winning game becomes a losing one.
2. Cost of trading. I = Y · σ · √(Q/V) - what it actually costs to get the position on. Four times the size is eight times the bill.
3. Capacity. Q* = V · (e / Yσ)² - the largest size at which your edge still exists. Simons' sentence, written as arithmetic.
4. Was it ever real. E[max SR] ≈ (1−γ)·Z⁻¹(1 − 1/N) + γ·Z⁻¹(1 − 1/Ne) - the Sharpe ratio you should expect from pure luck after N attempts.
5. What you keep. g = ⟨ln(1 + r)⟩ - the gap between the average return and the return you personally receive.
Five formulas. Zero forecasts.
1. How Much Do You Bet?

Start with the question that comes before every other question, and that almost nobody answers with arithmetic.
Assume you have found something real. A bet that pays even money and wins 55% of the time. You have $10,000. How much do you put on each flip?
The instinct is to answer with a feeling - a lot, because the odds are good; a little, because it might lose. Both are guesses. There is an exact answer, published in July 1956 by a physicist at Bell Labs named John Larry Kelly Jr., in a paper about the capacity of a noisy telephone line. He died nine years later at 41. The formula outlived him by seventy years and counting.

f* - the fraction of your capital to bet · p - probability of winning · q - probability of losing (1 − p) · b - how much you win per unit staked, at the offered odds
Read it as a sentence: bet the edge divided by the odds. There is no view about the next flip anywhere in it.
Run it. Even money means b = 1. Winning 55% of the time means p = 0.55, q = 0.45.

Ten percent of the account per bet. Not "a lot." Not "a little." Ten percent.
Kelly himself was blunt about what happens to the gambler who ignores the ceiling and pushes his whole stack, even in a game he is favoured to win:
> "This would be little comfort, however, since when N was large he would probably be broke and, in fact, would be broke with probability one if he continued indefinitely."
That is not a warning about bad luck. It is a statement that certainty of ruin is built into over-sizing, regardless of the edge.
Here is the same 55/45 game, run 100 times from $10,000, at three different sizes:
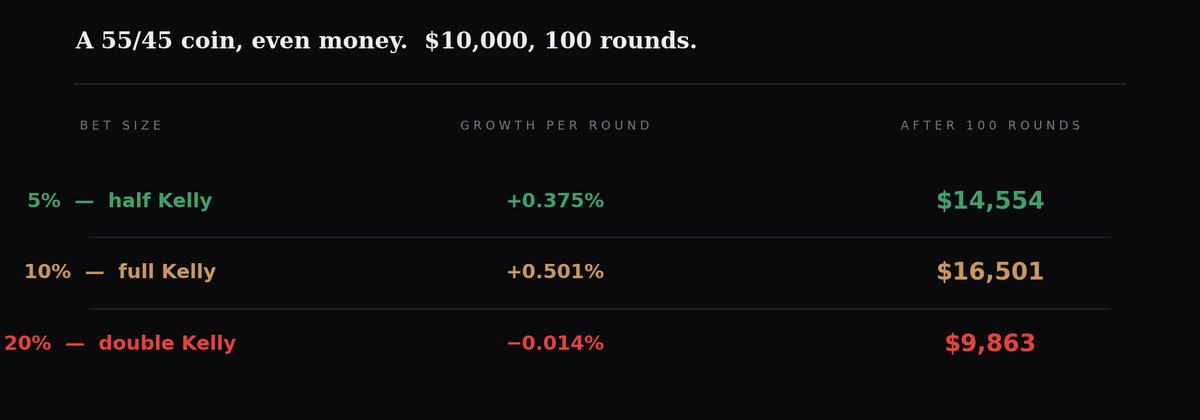
Look at the third row. Same edge. Same 55% win rate. Same favourable game - and you finish with less than you started, purely because the position was twice the size the math allows.
Edward Thorp, who carried Kelly's formula from the blackjack tables into a hedge fund that compounded at roughly 20% a year after fees for two decades without a single down quarter, put the asymmetry precisely:
> "The reason is that using too large an f* and overbetting is much more severely penalized than using too small an f* and underbetting."
Which is why professionals who use Kelly at all use a fraction of it. Half Kelly captures about 75% of the growth rate with far less violence on the way. Thorp's own conclusion was that since you never truly know your edge, you should deliberately size below what the formula says:
> "To the extent that future probabilities are uncertain, long term compounders should further limit their investment fraction enough to prevent a significant risk of overbetting."
A winning strategy sized wrong is a losing strategy. The edge tells you whether to bet. This tells you how much, and it is the difference between compounding and going home.
2. What Does the Trade Actually Cost?
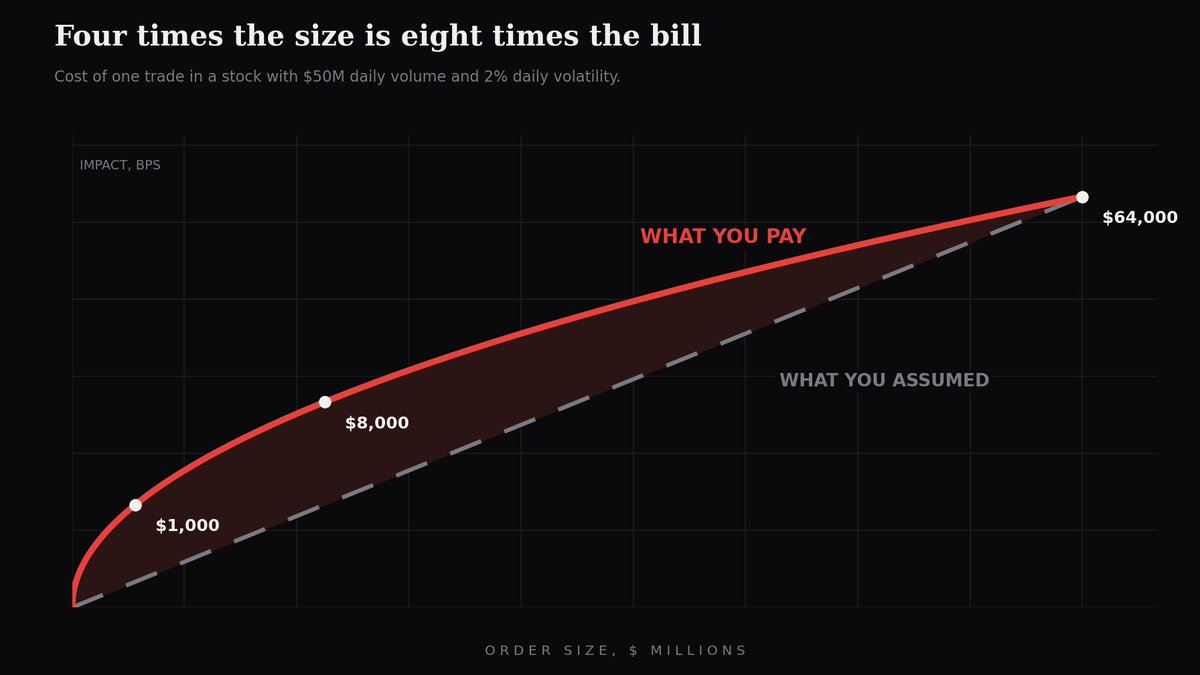
Every retail cost model is linear. Trade twice as much, pay twice as much. Spread times size, plus commission, done.
Markets do not work that way, and the gap between those two models is where scaled-up strategies go to die.
When you buy, you move the price against yourself. The first shares fill at the price you saw; the rest fill worse, because your own demand has eaten the resting liquidity. Push harder and you move further. The empirical relationship - one of the best-tested facts in market microstructure - is that impact grows with the square root of size.

I - impact, in basis points · Q - your order size, in currency · V - average daily volume, same units · σ - daily volatility, in basis points · Y - a fitted constant of order 1 (use Y = 1 until you measure your own)
Jean-Philippe Bouchaud and his co-authors, who have spent two decades measuring this across markets, state the consequence in one line that is worth memorising:
> "Numerically, Eq. (1) means that trading one hundredth of the daily volume moves the price by a tenth of its daily volatility, which is indeed a huge amplification."
One percent of daily volume costs you ten percent of a daily move. Not one percent of it. Ten.
And on how universally it holds, from the same paper:
> "It is quite remarkable that the square-root impact law appears to hold approximately in all cases."
The strongest recent confirmation came from Sato and Kanazawa, who did something unusual: rather than sample one broker's flow, they surveyed every trading account on every liquid stock on the Tokyo Stock Exchange across eight years. The square-root shape held at the level of individual stocks and at the level of individual traders.
Run it. A stock with 2% daily volatility (200 bps) and $50 million average daily volume.

The second row is Bouchaud's sentence in dollars: one hundredth of daily volume, one tenth of daily volatility, exactly 20 basis points.
Now read the last two rows against each other. Four times the size. Twice the cost per unit. Which is eight times the total bill - $8,000 becomes $64,000.
This is the arithmetic behind the most common story in trading: the strategy that worked for a year at small size and broke within a quarter of scaling up. Nothing failed. No regime changed. The signal still fires at the same times. The cost curve simply caught the edge curve, and nobody was warned because this cost never appears on a statement.
The spread is quoted. The commission is invoiced. The number that kills you is the one nobody bills you for.
3. How Big Can You Get Before It Stops Working?

Now put the first two together, and Simons' sentence becomes computable.
Your edge per trade is roughly flat in size. A 20 basis point signal is a 20 basis point signal whether you trade a thousand dollars or a million; the mispricing does not know how rich you are. Your cost per trade, from the previous section, rises with the square root of size.
One is flat. The other rises. They cross.
That crossing point is your capacity - the largest size at which you are still running a strategy rather than donating to the market. Set edge equal to impact and solve:

Run it. Same stock: σ = 200 bps, V = $50 million, measured net edge 20 bps per trade, Y = 1.

Half a million dollars per trade. Not a target - a ceiling.
Three properties of that formula are worth more than any indicator ever sold.
Capacity scales with the square of your edge. Double the edge, capacity goes up four times. A 10 bps edge in this stock carries $125,000. A 40 bps edge carries $2,000,000 - sixteen times the size from four times the edge.
Capacity is linear in liquidity. Ten times the volume, ten times the capacity. Which is why identical logic is fine in one instrument and hopeless in another, with no change to the idea.
And capacity scales with 1/Y². Halve your execution cost coefficient - split orders across hours instead of seconds, cross flow internally, be patient - and capacity quadruples. Same signal, nothing predicted better. In our example, halving Y moves the ceiling from $500,000 to $2,000,000.
That third property is what a large fund is really buying when it spends on execution infrastructure. Not foresight. A smaller Y.
And it is why Simons bought out his investors. Medallion has been closed to outside capital for roughly two decades and run at a capped size, widely reported around ten billion dollars. Consider what that means: the strongest documented track record in the industry, managers who would personally profit from taking more money, and they refuse it. There is no explanation except Q*. They know their edge, they know their Y, they have computed the crossing point, and they will not trade past it.
Simons also gave, in the same conversation, the cleanest statement of why any of their signals are worth trading at all:
> "Any one anomaly might be a random thing; however, if you have enough data you can tell that it's not."
Which is exactly the subject of the next formula.
Every strategy has a ceiling. The only question is whether you found yours with a formula or with a drawdown.
4. Was the Edge Ever There?

Everything above assumed the edge is real. Now the uncomfortable part, and it changes how you read every backtest you will ever run.
The problem is not that people lie. The problem is that searching is not free. Every variant you test is another ticket in a lottery against the noise, and if you buy enough tickets, one wins by luck alone and looks exactly like skill.
Marcos López de Prado, who has run quantitative research at some of the largest firms in the world, describes the mechanism without diplomacy:
> "One of the most pervasive mistakes in financial research is to take some data, run it through an ML algorithm, backtest the predictions, and repeat the sequence until a nice-looking backtest shows up. Academic journals are filled with such pseudo-discoveries, and even large hedge funds constantly fall into this trap."
Here is the formula that makes this precise. Given N independent attempts against a strategy with no edge whatsoever, the best Sharpe ratio you should expect to find by luck is:

Divide the result by the square root of your track record in years to put it in the annualised units everyone quotes.
Run it. Five years of daily data, 45 variants tested, and a strategy with zero real edge:

A Sharpe ratio of exactly 1.0, out of nothing at all. Not a good strategy that decayed. Not a real edge that got crowded. Forty-five rolls of a fair die and the best roll looked like a professional track record.
Push it further and it gets worse quickly:

Most people run hundreds of variants in an afternoon and then take the winner seriously. The table says a Sharpe of 1.4 from a thousand-variant grid search is not evidence of anything.
The authors who derived this - Bailey, Borwein, López de Prado and Zhu - drew the conclusion themselves, in the Notices of the American Mathematical Society:
> "It is not hard to overfit a backtest (indeed, the previous theorem shows that it is hard not to), so we suspect that a large proportion of backtests published in academic journals may be misleading."
They were right, and it has been measured. Hou, Xue and Zhang assembled 452 published anomalies and reproduced every one under a single consistent procedure. 65% failed to clear even a t-statistic of 1.96. Raise the bar to 2.78, which is what multiple testing demands, and 82% fail. Fewer than one in five peer-reviewed anomalies survives honest replication.
And the survivors decay. McLean and Pontiff tracked 97 anomalies through three phases: 0.582% per month in sample, 0.402% out of sample, 0.264% after publication. The first drop is overfitting, measured. The second is other people reading the paper and trading it away.

A published edge delivers about 45% of what its backtest claimed. Plan the business on 45% of your number. If it is not viable there, it is not viable - you have simply not waited long enough to find out.
The same authors put the practical warning better than any summary could:
> "The standard warning that 'past performance is not an indicator of future results' understates the risks associated with investing on overfit backtests."
The question is never "is this backtest good." It is "how many times did I roll before this one came up."
5. What Do You Actually Keep?

The last formula is the one people find hardest to believe, and it is why a portfolio can have a positive expected return and still take you to zero.
Here is a game. Each round, a coin flip. Heads, your wealth grows 50%. Tails, it falls 40%. Fair coin, no fees, no tricks.
The expected value per round:

Plus five percent per round. Every expected-value calculation says play forever.
Now compute what happens to one person actually playing. Over many rounds heads and tails arrive in roughly equal numbers, and wealth gets multiplied by both:

The same game. Plus five percent in expectation, minus five percent in reality. Start with ten thousand dollars and play 100 rounds:

Both numbers are correct. The average genuinely rises - carried by a vanishing number of astronomically lucky paths. You are not in them. You get one path, and one path decays.
Ole Peters, who has spent a decade arguing this point into economics, states it plainly:
> "The expectation value of wealth does not generally reflect what happens over time."
And in Nature Physics, on why this is not a footnote:
> "It may therefore come as a surprise to learn that the prevailing formulations of economic theory - expected utility theory and its descendants - make an indiscriminate assumption of ergodicity."
The general form is that the growth rate you experience is the average of the logarithm of your returns, not the average of the returns:

Because the logarithm punishes losses more than it rewards equal-sized gains, the number you receive is always less than or equal to the number you were shown. They are equal only when every period is identical. The gap has a name - variance drag - and it grows with volatility.
You have seen this without recognising it. A fund advertises +50%, −50%, +50% and calls it an average of 16.7%. Your money went $100 → $150 → $75 → $112.50. That is 4.0% a year, not 16.7%. Nobody lied. They used the average that flatters; the one describing your account is the other one.
And now the loop closes. Kelly derived his formula in 1956 for exactly this reason, and said so in his conclusion:
> "At every bet he maximizes the expected value of the logarithm of his capital. The reason has nothing to do with the value function which he attached to his money, but merely with the fact that it is the logarithm which is additive in repeated bets and to which the law of large numbers applies."
The first formula in this article exists to maximise the fifth. Bet sizing is not risk management bolted onto a strategy. It is the only way to make the return you receive resemble the return you were promised.
The average describes a crowd you are not in. You get one path through time, and the arithmetic of one path is not the arithmetic of the average.
The Whole Toolkit on One Screen
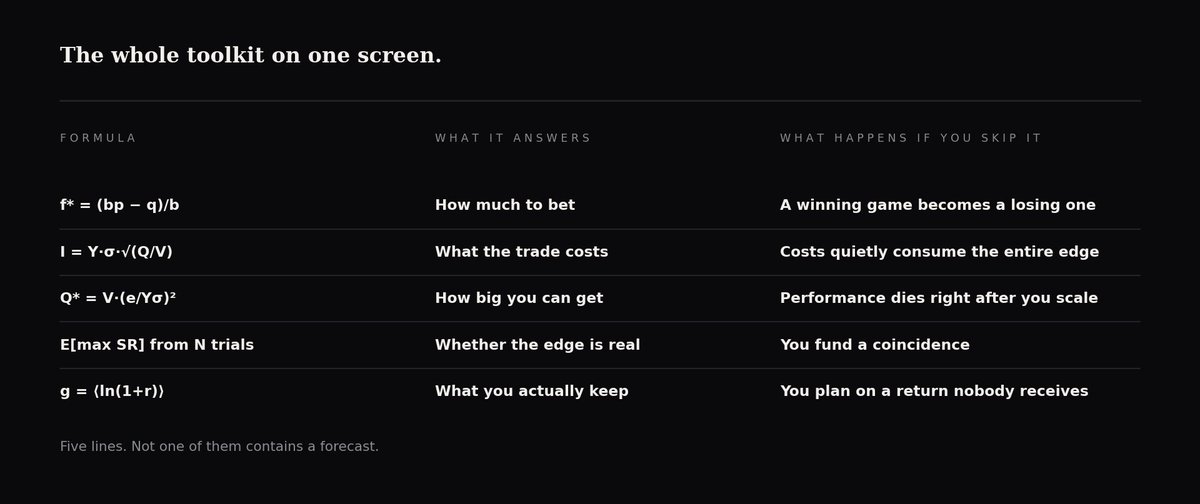
Five lines. Not one of them contains a forecast.
Where This Breaks
A set of formulas without failure modes is a sales pitch, so here are three.
Kelly assumes you know your edge. The formula takes p as given. In reality you estimated it, and if you overestimated it, Kelly hands you a bet size that is too large - in exactly the region where the penalty is asymmetric. This is the real reason for fractional Kelly, and it is not conservatism. It is an adjustment for the fact that your inputs are themselves estimates.
The capacity formula assumes your edge does not depend on size. For most strategies this holds. But any edge that comes from providing liquidity, harvesting a spread, or trading around order-book imbalance shrinks as you push, on top of the cost that rises. For those, true capacity is lower than the formula says, sometimes much lower.
And Y is not really 1. It is a fitted constant that varies by market, instrument and horizon, typically landing between 0.3 and 1.5. Using 1 keeps you honest but makes the output an order-of-magnitude estimate, not a precise limit. Which is why the useful question is never "is my capacity exactly $500,000." It is "am I at a tenth of it, at it, or well past it." That answer survives all the uncertainty.
Emanuel Derman and Paul Wilmott, in the document they wrote after the 2008 crisis, said the thing every user of these formulas should keep in front of them:
> "The most important question about any financial model is how wrong it is likely to be, and how useful it is despite its assumptions."
And, from the oath at the end of that same page:
> "I will remember that I didn't make the world, and it doesn't satisfy my equations."
The Question Worth Sitting With
Five formulas. One decides your bet size, one your cost, one your ceiling, one whether any of it was ever real, and one what survives the passage of time. Between them they explain most of the distance between a fund and a retail account holding the identical position - and none of that distance is prediction.
So here is the question.
If tomorrow you could have either a signal twice as strong as your current best, or execution costs cut in half - which do you take?
Run both through the capacity formula before you answer. Doubling the edge multiplies capacity by four. Halving Y also multiplies capacity by four. They are the same size of gift, which is almost certainly not what you expected - and which one is actually bigger for you depends entirely on where you sit relative to Q*.
Most people have never computed where they sit. That is the real edge in this article, and it costs nothing.
If this changed how you read a backtest - follow @Di_Krass_
What you just read is one topic out of roughly twenty that quietly decide how money is actually made, and none of them are taught anywhere you have been.
Every next piece works exactly like this one. Real math under plain words, every number computed rather than repeated, and an ending that leaves you seeing something you looked at yesterday differently.
Coming next:
The man who solved the market in 1900, and died unknown. A doctoral thesis that described random motion five years before Einstein, was graded "honorable," and sat unread for half a century before Wall Street built everything on it.
The average that nobody receives. Why a game with a positive expected value takes almost every player to zero, and why the word "average" means five different things - four of which are used to sell you something.
A stock that goes nowhere, and a machine that prints money from it. Claude Shannon's demon: how rebalancing extracts a real return from an asset with no return at all.
NASA built it to land on the Moon. Quants trade with it. The filter that separates the signal from the noise, in a lunar descent and in a bid-ask spread - the same equation, sixty years apart.
Difficult things, explained once and correctly. You will not stumble on a feed like this twice by accident.
Related articles

How to Build a One-Person Company That Runs from Slack
content finds ideas for X and YouTube.


The Hidden Mechanics Behind Building Wealth
A dollar left untouched cannot reproduce. Put that same dollar inside a productive system, however, and it can finance inventory, purchase part of a company, earn interest on a loan, absorb a risk so…