From Loops to Graphs: How to Run a Real Team of AI Agents

It is a quiet morning. No tabs are open, no coffee is even poured. Yet a finished report on the question you typed in one line last night is already sitting on the screen.
Five researchers dug at it overnight, each from a different angle, all in parallel. A sixth agent went down every finding and tried to kill it: is it made up, is it stale, does the source actually exist. What did not survive the check never reached the report. What did survive is in front of you, ranked by confidence, with links attached.
The last word is yours. You read it and decide what to do. You have not clicked a single button yet.
This is not new magic, and it is not another one-month hype cycle. It is a graph: a pattern critical systems have run on for decades, now pointed at a team of AI agents instead of a data pipeline.
One blunt truth before the fun begins: a graph buys breadth, not judgment. Five agents will find more than one, but they will not reason better than one. Confuse the two and you will pay for a team where a single agent would have done.
A couple of weeks ago you maybe stepped out of a loop for the first time and let the model run on its own. And the timeline has already declared loops yesterday's news, with the whole conversation moving to graphs. The good news is there is nothing here you cannot get in one evening, and not a line of code to write.
This piece covers seven things:
- what a graph actually is, from the ground up
- the diamond, the one pattern that genuinely pays
- the stop rule that protects your bill
- where exactly you stand in the whole thing
- three ready graphs you can paste and run today
- how to build your first graph in ten minutes
- the traps everyone walks into
Before we dive in: I post daily notes on AI and agents in my Telegram channel, along with ready prompts and breakdowns: https://t.me/shmidtai. It is free.

Part 1 · What a Graph Is, From the Ground Up
1.1 A graph is a plan for your work, drawn out
Drop the word "graph" for a second, along with everything you have seen in the posts. At heart it answers two questions: which jobs need to happen, and which job has to wait for which.
A job is something you would hand to one assistant: research one competitor, write one draft, check one claim. One job, one node.
When a job needs the result of another job before it can start, you connect the two with an arrow. And a small set of running notes travels with the work: what was found, what was decided, what is still left. That is the whole vocabulary. Nodes, arrows, notes.
The loop everyone was talking about last month is a graph of one node wired back to itself: do it, check it, not done, again. A graph is the same line of thinking, only now there are several jobs, and some of them can run at once.
1.2 Half your arrows are fake
Here is the one exercise worth doing tonight, before you open a single new tool.
Take the system you run right now, and for every "and then" inside it, ask one question: does the next job actually need the last job's result?
"Summarize this file and then check my calendar" sounds like a sequence. But the calendar step never needs the summary, not for a second. Those two jobs were never required to wait for each other. The arrow between them is fake, and the waiting is pure waste.
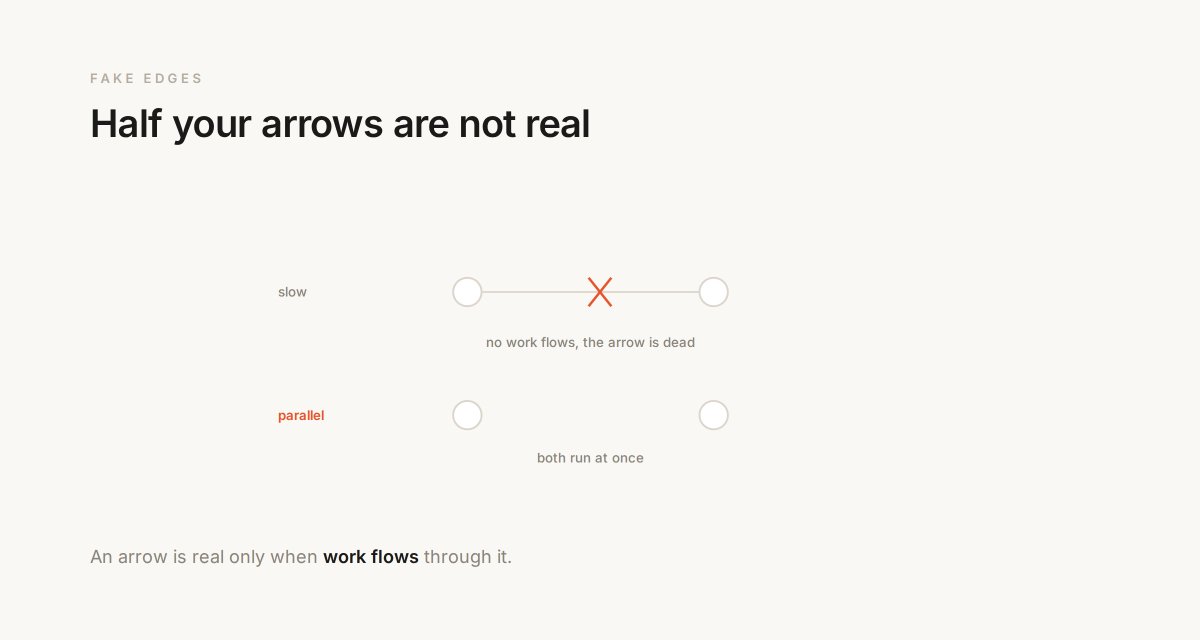
An arrow is real only when work actually flows through it. Draw your own system and you will find two or three fake arrows in any of them. Right now your system probably runs as one straight line where every job waits for the one before it. That works. And it is the slowest possible way to run things, because one stuck step blocks everything behind it.
A quick test for a fake arrow: cover the previous job with your thumb. If the next one can still start, there is no arrow between them, whatever your instinct says.
A short glossary so the rest reads clean:
- Node: one job for one agent.
- Arrow (edge): "this job waits on that one." Real only if work flows through it.
- State: the running notes, what was found and decided, riding along with the work.
- Fan-out: the moment one job splits into several running in parallel.
- Diamond: the shape "split, gather in parallel, check, merge back."
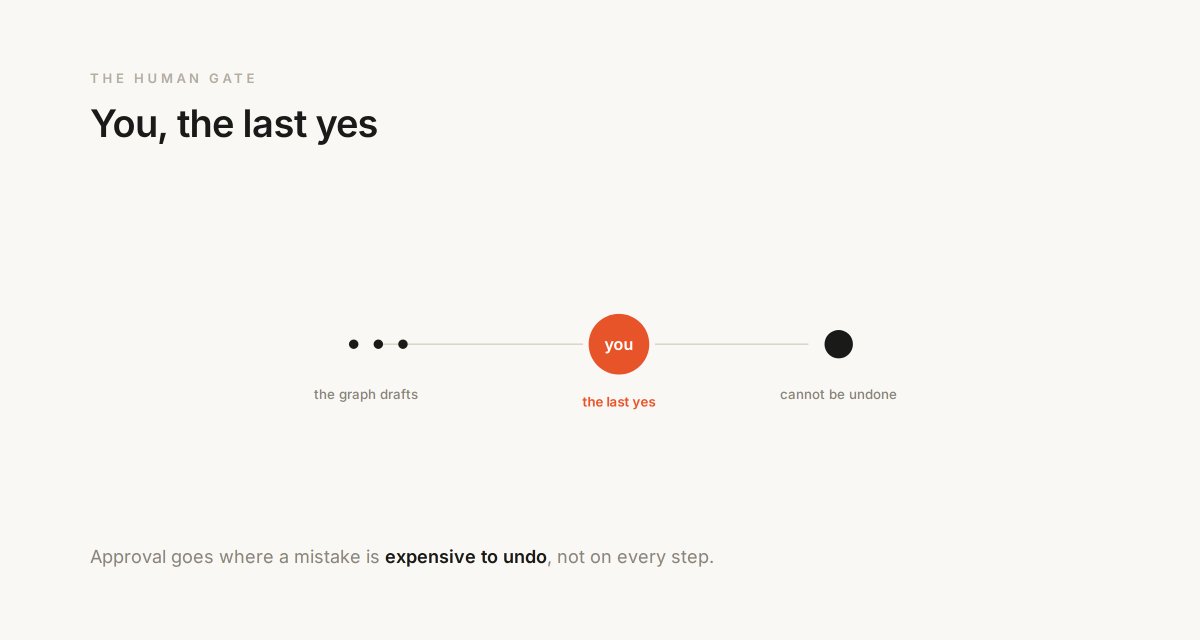
- Gate: the point where the flow hits a human and waits for their yes.
Part 2 · The Diamond, the One Pattern That Pays
Watch any serious agent system work and the same picture keeps surfacing. The work splits. Several workers dig side by side. Something checks what they found. And it all merges back into one answer.
That picture is called the diamond, and I am fairly confident it is the only pattern you will need this year.
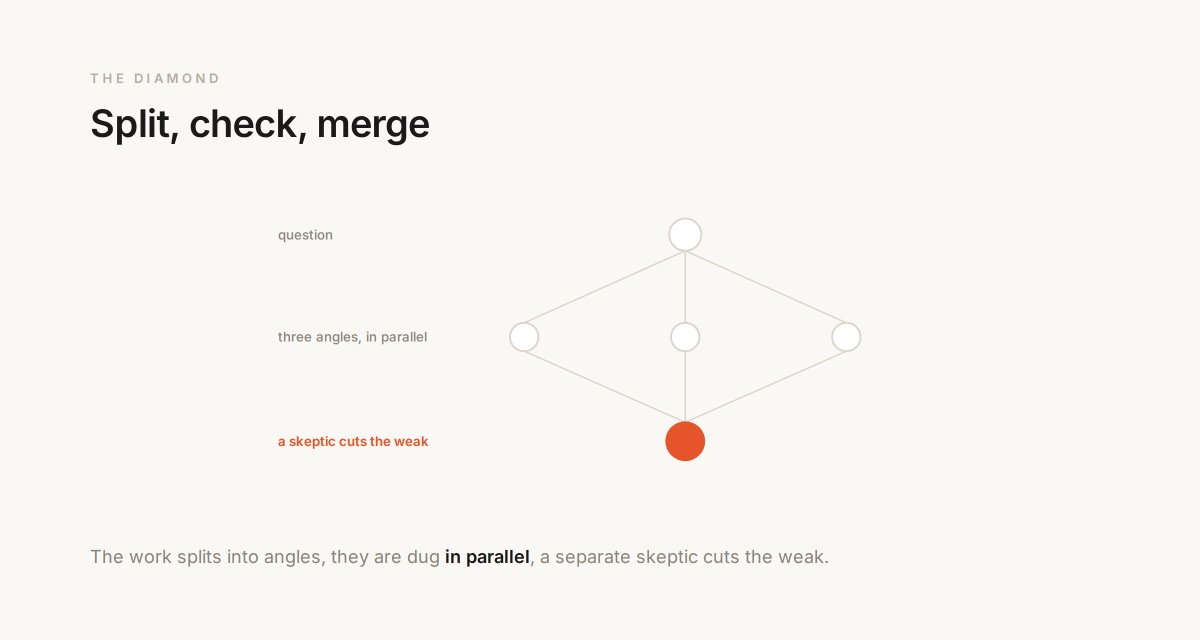
This is not whiteboard theory. The research feature inside Claude is built exactly this way: a lead agent plans, workers gather in parallel, each in its own separate context window, and a separate agent verifies the sources before anything reaches you. By Anthropic's own measurement, that team beat a single agent on the same engine by more than 90 percent on their internal research eval.
**-> How we built our multi-agent research system, Anthropic**
The reason is not that there were more agents. The reason is that the reasoning was spread across several separate context windows, which is a breadth a single agent physically cannot reach: it has one window, and it blurs.

Now the part everyone scrolls past. The check. Treat it as part of the pattern, not an option.
When researchers asked models point blank where the error was in their own chain of reasoning, the best of them got it right 52.9 percent of the time. That is barely better than a coin flip. Yet when the error is pointed out, the model fixes it well. The takeaway is simple: a model is close to useless at finding its own mistakes and good at fixing the ones you show it.
**-> Can large language models identify and correct their mistakes?, Google Research**
Hence the iron rule: never let an agent grade its own homework. Give the checking to a separate job whose only task is to kill weak findings before they reach you. And give every checker a different question. One asks if it is correct. One asks if it is current. One asks if the source exists at all. Three different questions catch three kinds of flaw; three identical ones catch only one.
One more rule for the checker: it only reads. Give it write access and it will quietly patch a weak finding instead of rejecting it. Same logic as a copy editor in a newsroom and a second approver on a payment: the second party is reliable not because it is smarter, but because it does not carry the first one's history.
2.1 What this pattern is already inside
The diamond is not something you have to invent. It already sits inside tools you may be using:
- Claude Code, sub-agents. It can run several sub-agents in parallel and merge their output when the prompt asks it to branch out (the word "workflow" is one such signal). This is where to start, with nothing extra installed.
- Research in Claude, that same lead agent plus parallel workers plus source verification. A live diamond in production, with the +90 percent number attached.
- The "orchestrator-workers" pattern Anthropic wrote up separately: an orchestrator splits the task, workers do the pieces, the orchestrator merges. That is the diamond in other words.
- LangGraph and similar frameworks, where you write nodes and edges explicitly, in code. Reach for them when the graph gets large and needs versioning and reuse.
**-> Building effective agents, Anthropic**
The takeaway is not "install another framework," it is the opposite: one tool runs your first graph today. You add a framework later, and only when you can name the reason you need it.
Part 3 · The Stop Rule That Protects Your Bill
More agents is not automatically better, and this is the part of the course that saves you real money.
When a team of agents and a single agent are handed the same budget, the team wins clearly on work that splits into independent pieces, and loses just as clearly on work where each step leans on the one before it. Breadth, the graph buys. Judgment, it does not.
That breadth carries a price tag, and not a small one. That same research team inside Claude burns roughly fifteen times more tokens than a normal chat. Fifteen times. On work that honestly splits, it is worth it. On work where everything is connected, you are just emptying your account fifteen times faster for an answer a single agent would have given for less.
A short picker to run before you launch anything:
One-off task                         -> a single sharp prompt
Recurring, but steps chain together   -> one agent, or a loop
Recurring and splits into pieces      -> a graph (diamond)
And on unit economics, because the "15x" number scares people for no reason. If a decision worth thousands sits behind the answer (a price, a hire, a market), the extra tokens are cents against dollars, and the graph pays off on the first run. If you run a diamond on connected trivia a single agent would close for pennies, you are paying fifteen times over for a mediocre answer. The graph is not expensive. A graph in the wrong place is.
Hence the stop rule, and it is short.
Before you add a single agent, ask the one question that decides the size of the bill: where does my work split? Where every step needs the full picture, stay with one agent. The moment the work breaks into pieces that never read each other's results, that is when the graph starts to pay. Not before.
It is the exact same discipline as with loops. A tool is stronger not where it is more complex, but where the task actually fits it.
Part 4 · You, the Last Node
You are the most important node in your own graph, and this part is about where exactly you should stand.
Every serious system routes the flow to a human before anything that cannot be undone. The send, the publish, the refund, the invoice, those are arrows that should end at you. Your approval is the last yes between a draft assembled on a pipeline and the outside world.
Klarna learned this one in public. The company pushed AI support across the equivalent of around 700 roles, then admitted the tilt toward cost cutting hurt service quality, and brought humans back as a premium layer on top of the AI. Its CEO, Sebastian Siemiatkowski, said it plainly: an overemphasis on cost cutting led to poorer service.
**-> Klarna reverses on AI, says customers like talking to people, Forbes**

The design rule fits in one line: put your approval where a mistake would be expensive to undo, not on every step. A gate on everything makes you the bottleneck. A gate on nothing means nobody is watching.
And four small rules that keep the graph from turning into an expensive accident:
- Every loop inside the graph has a ceiling on how many rounds it can run.
- Only one job writes to any one file. Two writers on one file is guaranteed corruption.
- The routing lives in written steps, and the AI fills the jobs. You set the shape, the model does the content.
- There is always a cap on how many agents can spawn, so the graph cannot breed them without end.
And judge the system by numbers that cannot lie: money that landed, customers that stayed, tests that passed. A system that only grades its own reports is confidently wrong.
Part 5 · What It Looks Like When It Runs
Here is what a run looks like when the graph is actually working. You do not see a wall of text, you see a short log:
Split:    question divided into 5 angles
Launch:   5 researchers in parallel
Gather:   23 findings, each with a link and a date
Skeptic:  9 findings killed (no source, stale)
Merge:    14 survivors, ranked by confidence
Pause:    waiting on your yes before saving the report
Nine findings out of twenty-three did not survive the check. That is the product. The difference between research and rumor collection is exactly that skeptic pass.
If you doubt that a team of agents is serious and here to stay: Anthropic's engineers built a working C compiler with a team of 16 parallel Claudes, around 100,000 lines of Rust. Not a three-function toy, a compiler. That is the upper edge of what the pattern already carries today.
**-> Building a C compiler with a team of parallel Claudes, Anthropic**
Part 6 · Three Graphs That Pay for Themselves
Each build below runs in Claude Code, ends with the exact prompt you paste, and keeps you as the gate. Claude Code can run sub-agents in parallel, and the prompt asks it to do exactly that: several researchers at once plus a separate checker, instead of one line of steps. The word "workflow" is the signal to branch out.
The prompts are kept as-is; models read them more precisely that way, and you do not have to write a line of code.
6.1 The Research Desk
Think of the last decision you made with real money behind it: a price change, a new offer, a market you almost entered. You probably decided it on a week of googling or an expensive analyst invoice. This graph replaces both.
Your question splits into five angles, five researchers dig at once, a skeptic attacks every finding, and only the survivors reach the final report, with their sources.

How to run it: open Claude Code in an empty folder, write your real question in one line, paste the prompt, watch the fan-out and the skeptic pass, read the report. Only what survives your read enters the decision.
i need decision-grade research on: [your question]. use a workflow:
split the question into 5 distinct angles, run one researcher per
angle in parallel, every finding needs a source link and a date,
then run a skeptic against each finding that tries to disprove it,
drop what fails, merge the survivors into one report ranked by
confidence, save it as research-report.md and show me the top findings
The first run takes minutes instead of days. The skeptic pass is the real product here: it is the difference between research and a collection of pretty rumors.
Tip: add a line to the end, "list what you could not verify." The list of what it failed to confirm is often more valuable than the findings, because it shows you where not to lean.
6.2 The SEO Content Machine
Be honest about your publishing schedule. For a lot of people it either costs a monthly retainer or it simply stopped happening. This graph produces one ranking-ready draft per run and never publishes without you.
Three researchers work side by side: one breaks down what the current top pages cover, one collects the real questions people ask about the topic, one finds what everyone skips. Their work merges into an outline, a draft is written from it, the draft is fact-checked, and it waits in your folder for your yes.
How to run it: take the one topic your customers type into search, paste the prompt, the three research jobs run at once, and the draft lands in a drafts folder with every shaky claim flagged at the top. You read it, fix what only you would know, and publish it yourself. Then ask Claude to save the workflow, and every Monday it becomes one command instead of an afternoon.
i want an article that can rank for: [topic]. use a workflow: run
three research jobs in parallel, one lists what the current
top-ranking pages cover, one collects the real questions people ask
about this topic, one finds what the top pages skip, merge all three
into an outline, write a full draft from the outline, then run a
fact-checker that flags every claim without a source, save the draft
to drafts/ with the flagged claims listed at the top, never publish
anything
Tip: keep the skeptic and the fact-checker as separate nodes with different questions. One checks the facts, the other checks whether the piece answers the reader's real question. Fuse them into one and you lose half the value.
6.3 The Go-to-Market Kit
You are launching something: a product, an offer, a service. The honest options were always two, weeks of prep or launching blind. This graph produces the full kit in one run, and you approve every piece.
Three researchers profile the buyer, the channels, and the competition in parallel. Their work merges into a one-page positioning doc, and the system pauses right there so you can read it: that page becomes the foundation every asset gets checked against. Then three writers produce the landing copy, the launch posts, and the outreach messages in parallel, a checker flags anything that drifted from the positioning, and the kit lands in a folder where nothing ships on its own.
How to run it: name the product and who it is for, one line each. Paste the prompt. Read the positioning page when the system pauses, the one step I would never skip. Let the three writers produce the assets, review what the checker flagged, and approve piece by piece.
i'm launching [product] for [audience]. use a workflow: run three
research jobs in parallel, one profiles the buyer and collects the
exact words they use, one maps where these buyers spend time online,
one collects how competitors pitch them, merge into a one-page
positioning doc and pause to show it to me, then run three writers in
parallel from that doc: landing page copy, a week of launch posts, a
set of outreach messages, then run a checker that compares every
asset against the positioning doc and flags anything off, save
everything to launch-kit/ and change nothing after that without
asking me
The pause on the positioning doc is not a courtesy, it is a gate. The one page you approved sets the voice for every asset at once. Skip it and the three writers scatter into three different brands.
Part 7 · Build Your First Graph in Ten Minutes
You have seen the theory, now the hands. Take a real question with money behind it and build the research desk from 6.1. On the clock:
3 minutes  -> write the question and name 5 angles to dig it from
3 minutes  -> paste the prompt with the word "workflow," launch the fan-out
2 minutes  -> add a skeptic node whose job is to kill findings with no source
2 minutes  -> add the gate: a pause and your yes before the report is saved
That is it. You have a working diamond and an understanding almost nobody on your timeline has. From here it is two moves only: save the workflow so it becomes one command, and add angles or checkers as you see where the graph goes blind.
Rule of the first graph: let it be ugly. Five angles instead of a perfect seven, one skeptic instead of three. A working rough graph teaches you more than a perfect one on paper.
Part 8 · The Traps Everyone Walks Into
A graph breaks in predictable ways. Here are five breaks as symptom, cause, fix, so you recognize them before they get expensive.
- The file turned to mush. Cause: two nodes wrote to it at once, racing. Fix: one writer per file, the rest read only. Want to assemble from pieces, add a dedicated merge node at the end.
- The skeptic waves everything through. Cause: you gave it the same question as the author, so it thinks the same way. Fix: hand the checker a different angle, "does the source exist," "is it current," not "is the work good."
- The bill hit the ceiling. Cause: the graph had no cap on agents or rounds, so it bred them. Fix: a hard cap on agents and a max number of rounds on every loop, always.
- You became the bottleneck. Cause: a gate sits on every step, so the graph waits on you constantly. Fix: gates only where a mistake is expensive to undo, let the rest flow.
- You paid 15x for a mediocre answer. Cause: a fan-out on connected work, where each step needed the last. Fix: go back to "where does the work split," and if there is no answer, stay with one agent.
The common thread across all five: a graph punishes a skipped rule with exactly the thing that rule protected. That is where the discipline comes from.
Part 9 · The Part Nobody Advertises
A graph changes the shape of the work. It does not remove you from it. And two things get worse, not better, as the graph gets good.
- The cost nobody mentions. The breadth you buy costs tokens, and we already saw the number: roughly fifteen times more than a normal chat. A graph pointed at connected work, where everything depends on everything, is the most expensive way to get a mediocre answer.
- Comprehension debt grows faster. A loop shipped code you did not write. A graph ships more of it, and faster, because it runs in parallel. The more smoothly it turns, the wider the gap between what goes out and what you have actually read.
And one trap that costs more than all of them. Skip that last yes and the graph ships its first confident mistake straight to a customer. A gate on everything makes you the bottleneck. A gate on nothing means the first confident miss goes out into the world under your name.
The takeaway is not discouraging, just realistic: a graph is a reach amplifier, not a replacement for judgment. Judge it by the numbers that cannot argue back, and keep a hand on the last gate.
Cheat sheet
Take this and apply it without rereading the rest:
- Fake edges first. Run nothing new until you have deleted the arrows no work flows through.
- Split only what never reads each other's results. Keep anything step-by-step on one agent.
- No finding travels unchecked, and no two checkers ask the same question.
- The checker only reads, so it cannot quietly patch the weak stuff.
- Every loop inside the graph has a ceiling on its rounds, and so does the agent count.
- One writer per file. The routing lives in written steps, the AI fills the jobs.
- The last yes sits exactly where a mistake would be expensive to undo.
- One tool is enough until you can name the reason it is not.
Three questions to ask before you build a graph:
- Where does my work actually split into independent pieces?
- What here is so expensive to undo that it should end at me?
- Would this finding survive a separate skeptic asking a different question?
Zoom out
Loops were a shift in who does the work. Graphs are a shift in how much of the work runs at once. But the point where all of it meets the real world has not moved an inch. It stayed exactly where it was, with you.
A graph does not make you smarter. It makes you wider. It takes on the waiting, the parallelism, the first cut of the weak stuff, and hands you back the seat the whole thing was built for: the last decision, with the full picture in hand.
Loops took manual prompting off your hands. Graphs take the manual waiting. Neither one takes the thinking, that stays with you. If you keep a single thing from this, keep that, then go draw your own system tonight, count the fake edges, and delete them. It costs nothing and usually removes more waiting than any tool you could buy.
If this landed, save it and follow me, there will be more ready graphs, prompts and breakdowns: https://t.me/shmidtai
@shmidtqq
Related articles

How to master graph engineering (Full Course)
I'm going to show you how to build your first agent graph and put it to work in your business today: A team of AI agents that researches in parallel, tries to kill its own findings, and hands you one…

10 SEO backlink Claude automations for 61k AI mentions in 3 months
Link building is trial and error.

The Guide to Dominate Local SEO (Automated with Claude)
"Here's my site: [url]. Audit my Google Business Profile setup. Find the top 3 competitors ranking locally for my main keyword, tell me which primary and secondary categories they use, and give me a…