How to Invest in 2026: A Plan Built on Research, Not Forecasts

It is 2026. The S&P 500 has just closed its third straight year of double-digit gains. The ten largest companies now make up about 40% of the index, an all-time record and nearly double their weight a decade ago. Valuations by CAPE have been higher only once, at the peak of the dot-com bubble. And every other headline promises to tell you "what to invest in for 2026."
This article answers the same question, but without forecasts. Only what the data has actually shown: 100 years of statistics across 26,000 stocks (Bessembinder), 25 years of SPIVA scorecards on active funds, research from Vanguard, Morningstar and J.P. Morgan, and a breakdown of 66,465 real brokerage accounts. At the end: a 7-step protocol. Every claim below can be checked against the original source.
1. Individual stocks: the math is against you
Professor Hendrik Bessembinder of Arizona State University took every US stock since 1926, roughly 26,000 tickers, and calculated which of them actually created wealth.

The results, worth knowing by heart:
57.4% of all stocks, over their entire lifetimes, returned less than one-month Treasury bills. More than half of all stocks lost to the most boring instrument on the market. The median stock produced a negative lifetime return.
The entire net gain of the US stock market over 90 years came from 4% of companies. The other 96%, combined, matched Treasury bills. Just five companies produced 10% of all wealth ever created.
In 2020, Bessembinder repeated the exercise on global data: 64,000 stocks across dozens of countries from 1991 to 2020. The result was even harsher: the entire net gain of the world market, $75.7 trillion, came from 2.4% of companies.
The takeaway for a regular person is direct. Buying individual stocks means playing a game where you need to find one company out of 25. Buying the whole index means you are guaranteed to own every future winner, before anyone knows who they are.
2. Active funds: the fresh score is 79 out of 100
Fine, I will not pick stocks myself, I will hand the money to a professional. There are exact numbers on this too. S&P Global has been publishing them for 25 straight years in its SPIVA scorecards.
The 2025 result: 79% of active large-cap US funds lost to the S&P 500. That is the fourth-worst year in the entire 25-year history of the scorecard. The year before, 65% lost.

Over long horizons it gets even more one-sided: over 20 years, roughly 92% of funds lose to the index.
Maybe you just need to pick a good manager? SPIVA tested that too, in a report called the Persistence Scorecard. Of the funds that finished in the top half in 2021, only a handful stayed in the top half over the next four years. For large-cap funds, the result was worse than a random distribution would produce. S&P's own wording: when an active fund beats the market, it is typically luck, not skill.
A professional with a team of analysts and a Bloomberg terminal loses to the index 4 times out of 5. That is the core argument for index funds, and it is statistical, not philosophical.
3. Fees: the only metric that reliably predicts results
In 2016, Russel Kinnel at Morningstar tested which fund characteristics actually predict future returns: past performance, ratings, stars. Fees won. Morningstar's own conclusion, verbatim: the expense ratio is the most proven predictor of future fund returns.
Numbers from the study: among the cheapest quintile of funds, 62% were successful (survived and beat their category). Among the most expensive: 20%.
Now what that costs in dollars. Take $100,000 for 30 years at a 7% market return. With a fee near zero you end with about $761,000. With a 1% annual fee: about $574,000. The difference is $187,000. One percent in fees ate a quarter of the final capital.

A practical benchmark: large index ETFs covering the whole market charge 0.03% to 0.20% a year today. Anything above 0.5% needs a very serious justification. Anything above 1% is statistically working against you.
4. Trading and timing: four studies, one result
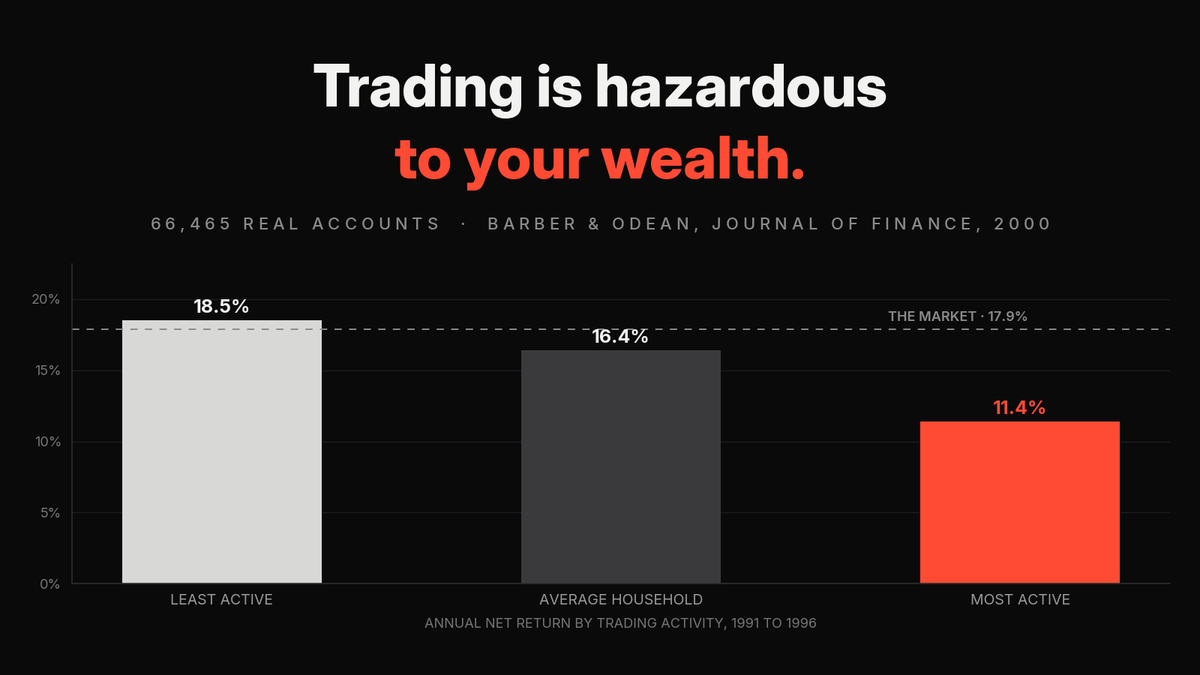
Study 1. Activity kills returns. Barber and Odean, Journal of Finance, 2000: a breakdown of 66,465 real brokerage accounts from 1991 to 1996. The most active traders earned 11.4% a year while the market returned 17.9%. The least active: 18.5%. Before costs, the groups' returns were nearly identical. The trades ate the entire difference. The paper's title speaks for itself: Trading Is Hazardous to Your Wealth.
Study 2. Day trading. The same team studied every day trader in Taiwan over 15 years, 1992 to 2006. The combined result of all day traders in the country was negative every single year, no exceptions.
Study 3. Stepping out of the market. J.P. Morgan Asset Management, 20 years of S&P 500 data. A fully invested portfolio: 10.6% a year. Miss the 10 best days out of 20 years: 6.4%. Miss 20 days: 3.7%. Miss 30 days: 1.5%. Thirty days out of five thousand decide almost everything. And the key detail: 7 of the 10 best days landed within two weeks of the 10 worst. Selling in a panic puts you on the sidelines precisely before the most profitable days.

Study 4. What the average investor loses on their own moves. Morningstar, the Mind the Gap 2025 report. Over 10 years, funds returned 8.2% a year. The average dollar invested in those same funds earned 7.0%. The difference, 1.2 percentage points a year, about 15% of all returns, was lost purely on entries and exits. The gap has held at roughly this level for a decade.
Four independent research teams, decades of data, one conclusion: every extra move costs money on average.
5. When to get in: now, or in pieces
The classic fear: the market is at a high, I will invest and it will immediately drop. Vanguard ran the numbers on data from 1976 to 2022, comparing investing the whole sum at once against spreading it over several months.
The result: investing everything at once beat spreading it out 68% of the time. The logic is simple: the market rises more often than it falls, and every month of waiting costs you expected returns. For a 100% equity portfolio, the median difference was 2.2% after just one year.
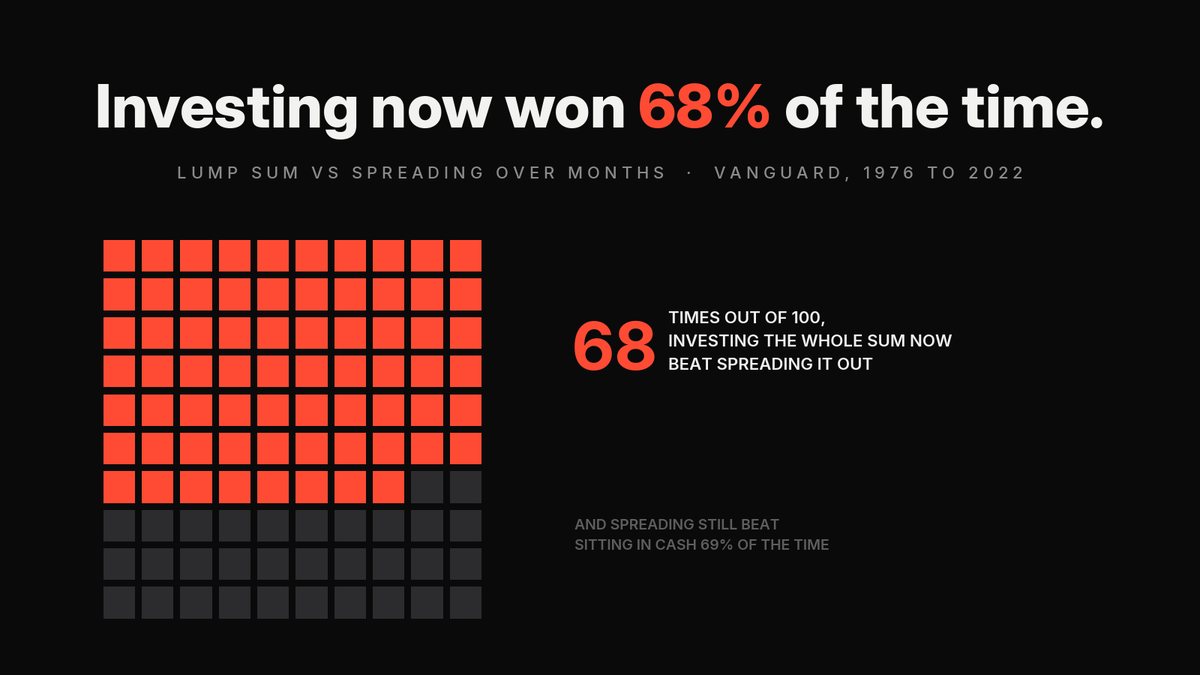
At the same time, spreading it out still beat sitting in cash 69% of the time. So the worst option of the three was never "getting in at a bad moment." It was not getting in at all.
The practical translation: if you have a lump sum, invest it now. If income arrives monthly, invest monthly, automatically, into any market, at the top or at the bottom. The second option is that same regular buying, just without the illusion that you are "catching the price."
6. What is specific about 2026
Two facts that separate today's market from the historical average.
Concentration. The top 10 companies make up about 40% of the S&P 500. In 2015 it was about 19%. Buying a "diversified" index of 500 companies, you are effectively betting nearly half your money on ten firms, most of them tied to a single theme: AI.

Valuations. CAPE (Shiller's cyclically adjusted P/E) sits around 39. In 150 years of data it has been higher only once, at the peak of the dot-com bubble in 2000. A high CAPE has historically never predicted the timing of a crash, but it correlates persistently with lower returns over the following 10 years.
What to do with this without turning into a forecaster. The answer comes from the same research: widen the diversification instead of abandoning it. A whole-world index instead of a single-country one (global funds hold thousands of companies across dozens of countries). Bonds, which since 2022 pay real yields again, as a counterweight to equities. And resisting the urge to load the portfolio with one more AI bet, because you already own that bet: through the index, at the largest weight in recorded history.
7. The protocol: 7 steps
- Emergency fund first. 3 to 6 months of expenses in an instantly accessible account. Invested money cannot double as a safety net, it runs on a different clock.
- Invest only money you will not need for at least 5 years. Over one year the market is unpredictable. Over every 15+ year window in history, the S&P 500 has never shown a loss.
- The core of the portfolio: a total-market or whole-world index fund. Expense ratio at 0.2% or below. This one decision closes out the findings of sections 1 and 2 at once.
- Have a lump sum: invest it now. Have monthly income: buy monthly. Automatically, with no judgment about whether "the moment is right." Section 5.
- Do not sell into declines. Missing the 10 best days cuts 20 years of returns nearly in half, and those days hide inside the worst weeks. Section 4.
- Want to pick stocks: build a sandbox. 5 to 10% of the portfolio, no more. If you beat your own index fund over a couple of years, revisit the proportion. Bessembinder's data suggests how that usually ends.
- Rebalance once a year. Return the stock/bond mix to plan, close the app. Anything more frequent statistically works against you: Mind the Gap, section 4.
The bottom line
Bessembinder: 96% of stocks combined created nothing, 4% produced all the growth, so you want to own all of them at once. SPIVA: 79% of professionals lost to the index in 2025 and 92% lose over 20 years, so paying for active management is statistically a bad trade. Morningstar: fees predict outcomes better than any rating, and jumping in and out costs investors 15% of their returns. J.P. Morgan: 30 days out of 5,000 decide everything, and they cannot be predicted. Vanguard: 68% of the time, the best moment to invest is called "now."
Across 100 years of data, the market has consistently paid for three things: breadth, low fees, and time. Everything else, on average, it took back.
Related articles

What Watching Fomo’s Rise Taught Me About Vector
*Reflections on product-market fit, finding a bigger market, and the future of social trading.*

7 faceless YouTube hooks i used to generate 200M+ views (steal these)
i've written hooks for 8,000+ youtube scripts across 50+ niches.

Why AI UGC STILL Beats Hiring Real Creators in 2026
the argument against AI creators was always that they looked fake, and 2 years ago that was fair.