Recession? What's Happening in 2026

The common assumption when everyone is focused on the " recession yes or no?" is that they are positioning for the next 3 months, instead of how the cycle actually resolves.
Personally, I dont care about wether a recession is declared and diagnosed officially or not. What I care about is the shape of the recovery, because the shape is what decided how long liquidity stays away from risk assets.
And interesting fact is that we got the crypto bear market in 2026 without the recession. This is the most important part in my opinion.
Before going further, one thing to set up front which holds through the whole article.
Before going further, one thing to set up front.
Every definition, indicator and shape in this post is measured on the US economy. Not global GDP. Not your local economy. I chose this for two reasons:
- The US sets the reference cycle everyone else gets compared against.
- It produces the dollar liquidity that prices every risk asset on earth, crypto included.
When people say "recession" in a market conversation, they are usually referring to the US one.
Definition of Recession
There are two definitions and most people only know the weak one.
Definition [simplified version]: Two consecutive quarters of negative real GDP growth. This measure is widely applied by financial analysts, journalists and policy makers, due to its simplicity.
Defintion [NBER]: A significant decline in economic activity spread across economy and lasting more than a few months. The assessment is made by the NBER Business Cycle Dating Committee, which evaluates real GDP, employment, industrial production and consumer spending collectively rather than relying on a single measure.
The difference matters more than it sounds.
Under the NBER framing, two negative quarters do not automatically mean recession unless the other indicators confirm a broad and prolonged decline. So the economy can feel broken long before anything is officially declared, and it can be declared long after the market already priced it.
The following are the indicators that actually get watched and what each one is telling you.
Two batches of indicators are taken into consideration.
The first batch (listed below) tells you where the economy has already been.
Real GDP: The headline measure of output. Definitive but the slowest thing on this list to turn.
CPI and PPI: inflation at the consumer and producer level. This is what decided how much room Fed has to respond.
Retail Sales: Whether consumers are still spending, which is roughly 2/3 of the US economy.
Job Creation & Umemployment Rate: The labour market. The Fed reacts to this faster than anything else.
The second batch of indicators (listed below) tells you where the economy is going.
Housing Market: The most rate-sensitive criteria, so it cracks first and recovers last.
Inverted Yield Curve: The bond market pricing a slowdown before it appears in the hard data.
M2 Money Supply: How much money is actually in the system. The single most relevant line on this list for crypto.
Credit Spreads: What lenders demand for taking risk. Widening spreads mean fear is repricing.
Deliquency & Default Rates: Whether households and companies can still pay. A late signal but very hard to fake.
Stock Market Performance: Sentiment and the wealth effect, which loops back into consumer spending.
Governments rarely announce a recession while you are inside it. Recessions are usually recognized in hindsight. That is exactly why traders keep getting surprised by them.
The Five Recovery Shapes
All recessions start the same way, with a meaningful period of economic decline. How the end is where lies the difference. Economists name the shapes after what the recovery looks like on a chart.
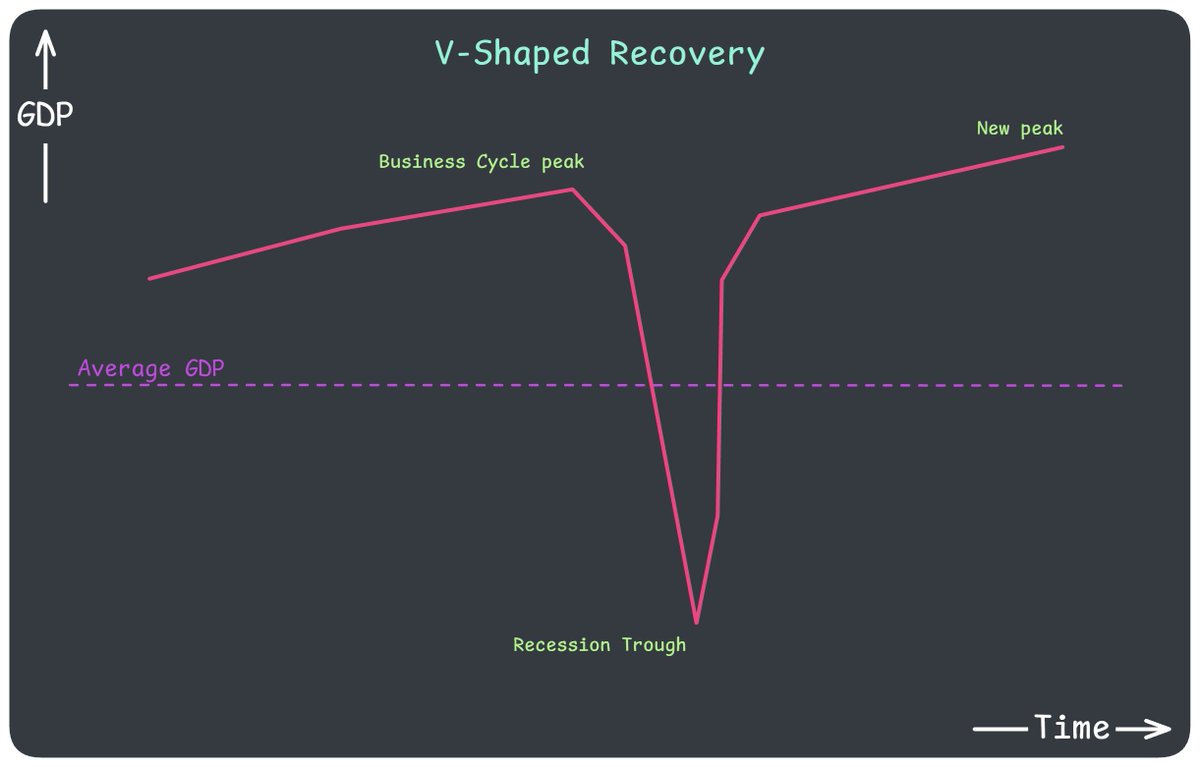
- V-Shaped Recovery Steep decline, then an almost immediate return to pre-recession levels. The time spent at the bottom is extremely short. Example: The 1953 recession. The economy made a full comeback by Q1 1954, less than a year after the decline started. The downtrend was mild and the Fed spotted the slowdown early and increased spending moderately to stimulate the economy
 — "Fig 1. V-Shaped Recovery: the sharp bounce"
- U-Shaped Recovery Same steep decline, but the economy sits at the trough for longer before improving. It does not necessarily mean a deeper GDP loss. It means a longer one! Example: the 1973-1975 recession. The economy did not resume pre-recession levels until 1976.
 — "Fig 2. U-Shaped Recovery: the slow grind back"
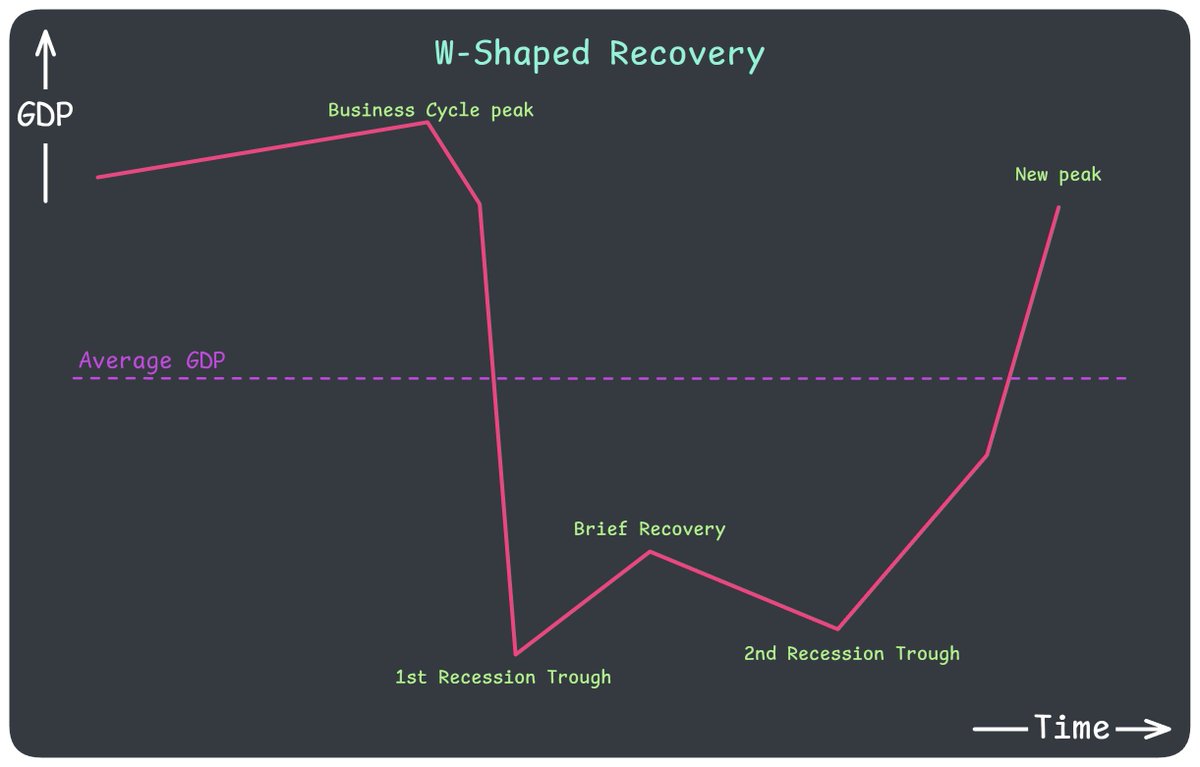
- W-Shaped Recovery Recession, a mini recovery, second recession and then the main recovery. It prolongs the impact of first decline ad destroys confidence because people who bought the first recovery get punished a second time. Example: The only W-shaped recovery the US has ever had was in the early 1980s. The economy dipped in Jan 1980 and recovered 6 months later. The the Fed raised rates to fight inflation and the economy fell into a second dip in Jul 1981 that laster for almost 16 months.
 — "Fig 3. W-Shaped Recovery : the double dip"
- L-Shaped Recovery The worst outcome, improvement drags along slowl, sometimes for years. It is sometimes called a depression. Example: The Great Recession. Techincally it lasted only 2007 to 2009 measured by GDP, but many other key economic indicators did not reach pre-recession levels for 4 to 6 years and a decade later the over economy was still lagging behind pre-recession projections.
 — "Fig 4. The L-Shaped Recovey: the long hobble"
- K-Shaped Recovery The newest shape. created after COVID-19 to describe what economists were actually observing. One segment of economy trends upward like a V or U, while another sinks further or recover much slower like an L. Two diagonal lines, one is up, and the other is down. Example: Covid. Hightech and e-commerce thrived. Zoom stock rose almost 6x from the start to the end of 2020 and its revenue was up 367% that year. Travel and hospitality were destroyed. American Airlines Q4 2020 revenue was down 64% year on year with a full-year net loss of $8.9B.
 — "Fig 5. The K-shaped Recovery: recovery for some, not for the others"
V and U are the most common, the others are far from unheard of. But keep the K-shaped recovery in mind, because it is the shape that describes 2026 best.
How the US Reaches Crypto
Crypto is global, but the US is not a small participant.
> North America, led by the US, received $2.3T in crypto transactions value between Jul 2024 and Jun 2025, which is 26% of all global transaction activity. The US ranks second in the Chainanalysis Global Adoption Index, and the dollar is the world's largest fiat on-ramp at over $2.4T in volume, almost four times the next highest country. 45% of North American transactions value moves in transfers over $10M, the highest in the world. Europe is a distant second at 34%. This is an institutional market, not a retail one.
Notice: China looks missing from these numbers, but it is not. Trading and mining were banned in 2021, so the activity moved offshore to OTC desks, P2P networks and Hong Kong, and now gets counted under whatever venue handles it. Roughly 59m Chinese holders remain, around 10% of global users. They trade dollar pairs and settle in dollar stablecoins, same as everyone else offshore. The ban is evidence for the argument above, not against it. The one real counterweight is the digital yuan, which Beijing is pushing specifically to cut dollar reliance. Long term challenge, not a present day one.
The pressure reaches crypto through 3 channels.
- Risk Appetite: A US slowdown pushes domestic ivestors to withdraw capital from high risk assets. Crypto sits at the far end of risk curve and it gets sold first and the hardest.
- The Dollar: The USD holds 57.13% of global FX reserves and sits on one side of roughly 89% of all FX turnover, so its direction prices everything else. But it has been stuck between 95.7 and 102 all year. Bitcoin fell 50% while the dollar went sideways, then ran toward $80k within days of DXY hitting a 3 month low on 21 August. So the dollar moves crypto at the margin. It did not cause this bear market. the global liquidity did it.
- Global liquidity: When the Fed tightens or refuses to ease, it tightens the whole world. Rates have sat at 3.5% to 3.75% since December 2025, unchanged at every meeting this year, with three regional presidents voting to hike in July and markets pricing roughly 64% odds of a hike in September. No cuts, no easing, no new liquidity. That is the drawdown explained, and it needed no recession.
2008 was the same channel at full force. US housing and finance broke, interconnected banking spread it worldwide through CDOs and MBS, and risk appetite vanished everywhere. So crypto does not trade the US economy. It trades the US policy stance. A recession matters only because it normally forces that stance to change, and this cycle it has not.
August 2026 Status
No US Recession Observed
> Every quarter since the crypto peak was positive. Q3 2025 +4.4%, Q4 2025 +0.5%, Q1 2026 +2.1%, Q2 2026 +1.5% annualised. The NBER has not declared one. By its dating, the US has been in expansion since April 2020. Unemployment sits near 4.2%, and forecasters still see about 2.1% growth for 2026. Recession odds run 30% to 42% depending on the source. Prediction markets price "no recession by end of 2026" above 90%.
Crypto Had A Brutal Year
> BTC peaked near $126k on early October 2025, then spent eight months in a drawdown, trading $63k to $65.4k through most of the summer. Most altcoins fell harder, many down 60% to 80% from their own peaks. Late August finally delivered a rally toward $80k, on a $3B short squeeze and $1.92B into US spot Bitcoin ETFs in the week to 22 August, the largest weekly total since October 2025.
Growing economy with no recession, but BTC still lost half its value.
Two K-Shapes
Right now the K is showing up at two levels at once and this is the most useful lens available.
Embedded post:
Author: Sen. Bernie Sanders (@SenSanders) Post ID: 2094775659574730975 Source: https://x.com/SenSanders/status/2094775659574730975 Posted: 2026-09-01T13:13:30.000Z Reply to: none
Text:
> The CEOs of major AI companies acknowledge that they are losing control of their incredibly dangerous technology. > > It is irresponsible to let them make it even more powerful. > > For the sake of humanity CEOs must immediately pause AI development. > > That pause must be international in scope.
Media:
Economy-Wise: Companies are pouring money into AI, mostly data centres and the hardware to fill them, and the Fed itself credited most of the recent strength in business investment to that buildout [Yet the genius Sen.Bernie Sanders thinks we must hit the pause button on AI 😂].
Meanwhile the housing market is frozen, hiring is motionless, and lower income households are getting squeezed by high prices and rates while wealthier households keep overall spending alive.
Crypto-Wise: BTC dominance closed last week at around 60%, up 0.91% on the week, breaking above a descending trendline drawn from the June 2025 high. The CMC Altcoin Season Index reads 26 out of 100, down from 38 last week and 52 a month ago, against a threshold of 75 for altseason. Capital did not leave crypto in this drawdown. It concentrated in Bitcoin and abandoned the tail.
Then late August looked like it broke that pattern. ETH ran hard, to around $2.47k against BTC at $78.8k, putting the ETH/BTC ratio near 0.0313 with weekly RSI near 60 and rising. That part is real.
But look at what the index did through that same rally. It fell from 38 to 26. Dominance rose rather than falling, and open interest dropped to a 2-month low, meaning the move was spot buying and short covering rather than fresh leveraged conviction. A handful of names ran while the other ninety kept losing ground to Bitcoin. Selective bid, not altseason.
> In a K, that distinction is the whole game. The question is never Will Crypto Recover?. > > The question is which leg of the K your bags are sitting on.
Related articles

How I Make $20k/Month With Pixar Animations (and how you can too)
Every time I've made the most money in my life it came down to right time, right skill. AI Animations are exactly this to me right now
How to launch a one-person product (without destroying your life)
Over the last 5 years, I’ve helped launch products that went on to make multiple 7 figures in revenue per year.

the whop partner business model explained in 5 minutes...
every online business model is a trade between 3 things.